We will have limited operations from 15:00 Tuesday 24 December 2024 (AEDT) until Thursday 2 January 2025. Find out how to contact us during the holiday period.
From 1-21 June 2009 the TGA conducted an online survey of stakeholders seeking feedback on satisfaction in relation to the effectiveness of the TGA's communication and consultation processes.
Consumers, patients, healthcare professionals and anyone connected to the medical products industry were all asked to complete the survey.
The survey was designed by the TGA. The Australian Bureau of Statistics (ABS) Statistical Clearing House assessed the survey methods and questionnaire and cleared the survey for launch. The ABS Statistical Clearing House will also be conducting a review of the results.
Survey results
Some initial results of the survey are available that show:
- who responded to the survey
- the areas people are interested in
- reasons and methods of contacting the TGA
- how many people have used the TGA eBusiness Services and TGA information websites and how often they use them
- overall satisfaction with the TGA's communication and consultation processes.
Helpful information about what we asked in the survey
What does the TGA mean by COMMUNICATION?
For the purpose of this survey the TGA looked at the way we communicate via our website, emails, letters, consultation documents and phone calls.
What does the TGA mean by CONSULTATION?
The TGA undertakes consultation when proposing new regulatory requirements, or changes to existing processes which may impact on its stakeholders. We do this in many ways such as:
- releasing draft documents on the TGA website and inviting comments
- holding meetings with people who have a particular interest in that area
- arranging presentations in major cities and inviting people to attend
Queries
Please email surveys@tga.gov.au.
Detailed survey results
Between 1 and 21 June 2009, the TGA conducted an online survey seeking feedback about its communication and consultation processes. In the 21 days the survey was open we received 1618 responses. This is a fantastic response and we would like to thank everyone who took the time to complete the survey.
Some initial results are shown below. As we continue with our research and analysis, the TGA will be publishing more results.
Please note: if you are unable to see the charts shown below, please contact surveys@tga.gov.au and the information will be provided for you in textual form.
Who responded to the survey
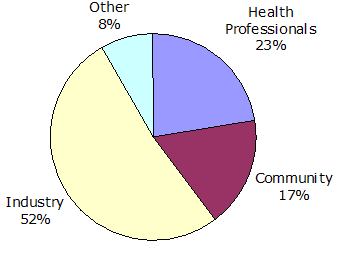
52% of respondents to the survey are working in the therapeutic goods industry - either sponsoring or manufacturing products.
The other 48% of respondents were from outside the therapeutic goods industry:
- 23% were health professionals,
- 17% said that they could best be described as community members and
- 8% identified themselves as "other"1.
Chart 1: Survey respondents

1 Other includes:
- Retailers
- Government employees
- Academics
- Media
Area of interest
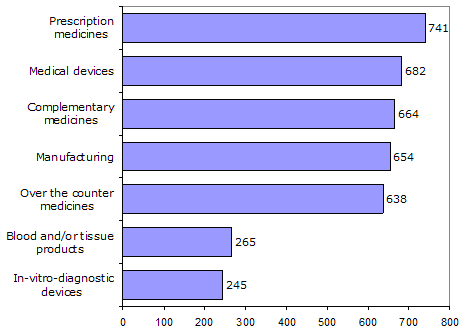
Respondents to the survey were asked to identify their main area of interest. The results showed that the majority of survey respondents are interested in prescription medicines.
Please note that respondents were asked to select all the areas that they were interested in so the total is more than 1618.
Chart 2: Area of interest

Reasons and methods of contacting the TGA
The majority of respondents contact the TGA via email to lodge an application or check on the progress of an application.
The ways that respondents contact the TGA are shown in Chart 3.
Please note that respondents were asked to select all the ways that they contact the TGA.
Chart 3: Methods of contacting the TGA

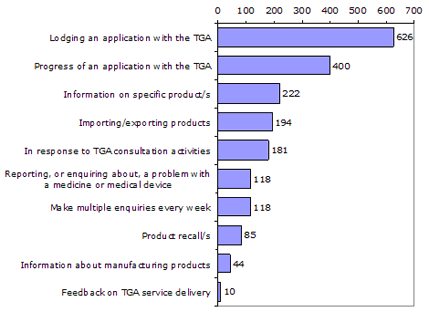
The reasons that respondents currently contact the TGA are shown in Chart 4.
Please note that respondents could select two choices.
Chart 4: Reasons for contacting the TGA

TGA Websites - eBusiness Services and TGA information website
- 63% of respondents have used the TGA eBusiness Services Website
- 91% have used the TGA information website.
Charts 5 and 6 show how often they access these websites.
| Chart 5: TGA eBusiness Services website  | Chart 6: TGA information website  |
Overall satisfaction with our communications and consultation processes
Overall:
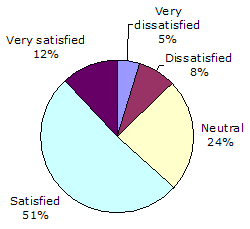
- 63% of respondents were satisfied or very satisfied with our current communications processes.
- 54% of respondents were satisfied or very satisfied with our current consultation processes.
The data also shows that almost a quarter of respondents were neutral about our current communication processes and one third of those who had been involved in consultation are also neutral about our current processes.
Chart 7 shows how satisfied respondents who have communicated with the TGA were with the process.
Chart 7: Satisfaction with communications processes

41% of respondents have been involved in a consultative process conducted by the TGA. The satisfaction with the overall experience is shown in Chart 8.
Chart 8: Satisfaction with consultation processes

Although this feedback is largely positive, the TGA is still looking at ways to improve our communication and consultation processes so that our stakeholders can become more positive about their experience of communicating and/or consulting with the TGA.


